Boussinesq Stress Analysis
Dash • PlotlyCompute and visualize stress distributions under loaded foundations using the classical Boussinesq solution. Supports strip footings (analytical), circular footings (numerical integration), and trapezoidal loads.
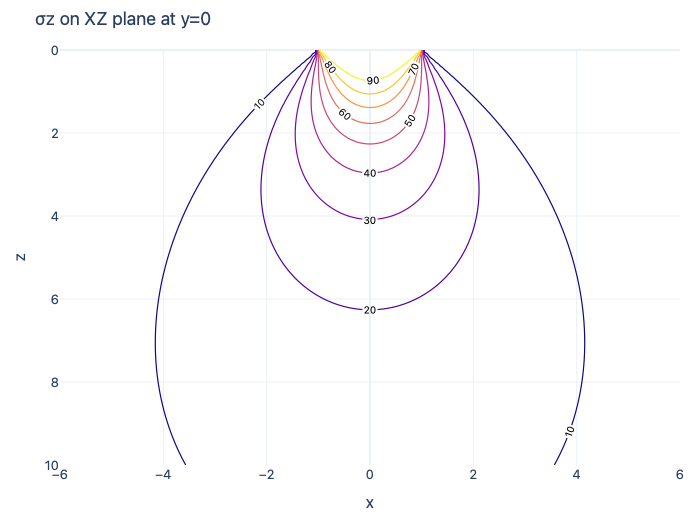
- Line plots, heatmaps, and contour isobars
- Multiple stress components (σz, σx, σy, τxz, τrz)
- Foundation rotation/translation, custom grids, CSV export
- Responsive UI with interactive zoom/pan and hover data